nanoStream Cloud now features nanoStream Analytics – a great way to monitor and analyze the performance and quality of service of your live streams.
nanoStream Cloud and the unique nanoStream H5Live Player have been designed as an easy to use ultra-low-latency and light-weight live streaming platform. nanoStream Analytics follows the same philosophy. Easy to use, lightweight and focused on delivering our partners the information that makes their business more successful.
nanoStream Analytics covers three levels of information:
- Live Stream Analytics: This area provides information about usage, traffic volume, countries, customers, IP’s and provides a world map overview regarding ingest/playout. On the trouble shooting page clients can investigate stream and user specific metrics, information available from stream ingest to the playout on the end user’s side. This feature provides a comprehensive overview and helps finding and solving potential issues regarding streaming performance. To look at specific issues in detail, a time filter can be applied and playout statistics can be shown in regards to an IP address or a user ID. Further information may be provided e.g. by Stream Playout Information or charts that visualize various player metrics to name just a few.
The troubleshooting function will analyze the ingest quality and allow customers to verify where issues might be happening:
- Live encoder settings
- Workflow
- ISP: internet provider from customer to ingest point
- Please also see the latest features of our nanoStream Analytics Release 2.11
- Business Intelligence: Here clients can find information about several aggregated metrics. Example Tagging: live streams can be tagged by topics or events and then a query can be run in the Analytics dashboard. By using the country filter insight on how certain countries perform compared to each other may be found.
- H5Live Metrics Customers Area: This provides additional insight and details about the player clients: we show H5Live player information like OS/browser, max. concurrent viewers, play buffer ratio, startup time, player error codes and other events like buffer play ratio and latency, both shown as graphs and on a world map.
All of this data is meant to help to improve the Quality of Service and viewers’ Quality of Experience. Overall, by using nanoStream Analytics, your technical team will have full insights on how your service behaves.
In addition to improving technical capabilities, nanoStream Analytics enables also a big advantage to business intelligence. It provides valuable data to management, marketing and sales and helps to make the right strategic choices.
Below you will learn how to use the nanoStream Analytics dashboard based on some examples and screenshots.
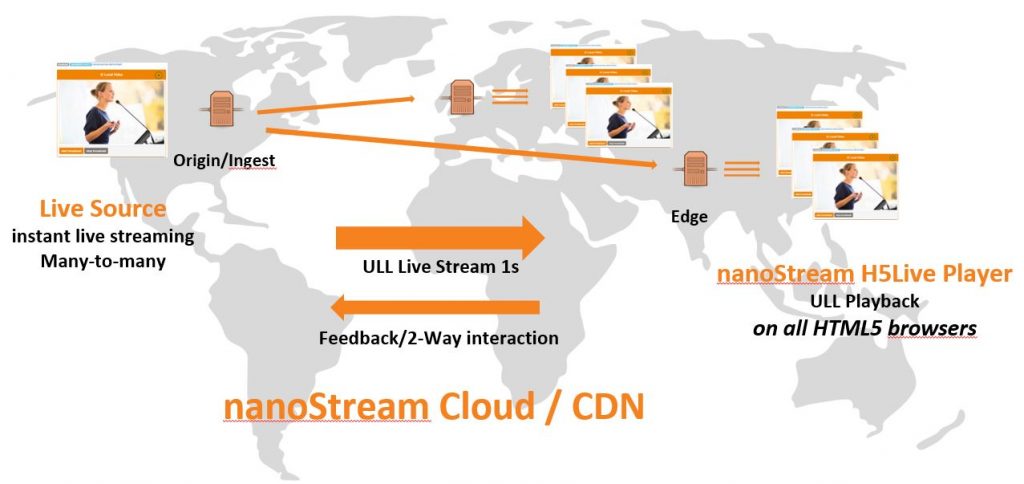
Getting Started
It’s very easy to get started. Login to your nanoStream Analytics account with your nanoStream Cloud credentials from the bintu dashboard.

Filtering your data
Easily filter your data , by “country” or “tag” to show you the numbers and information based on the selections you have made.
For the tag filter to work you must have created your tags in your Bintu dashboard or API. Next paragraph explains you how to do that.
Tagging is a very valuable feature for your business analytics and can help you finding data with a few clicks.

Tagging your streams
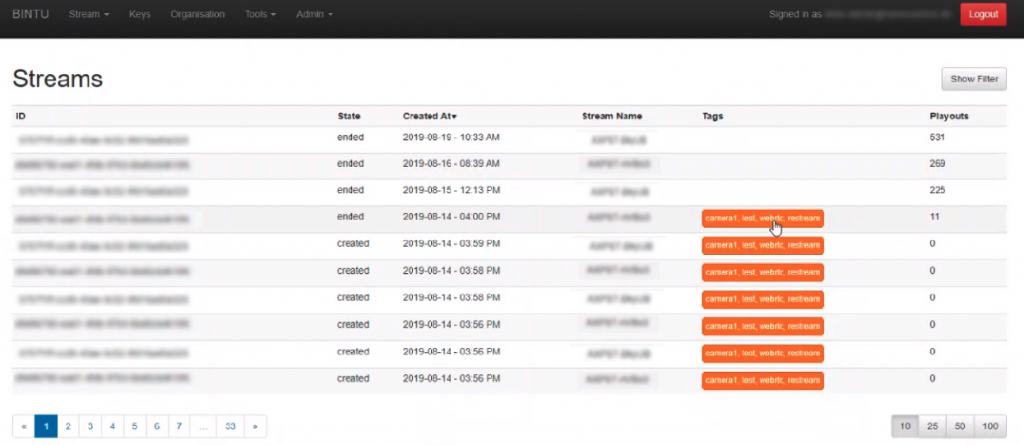
It starts at the stream creation bintu level. When you create a new stream you can give it a tag, which is a name or description, either human readable or any other text based code you choose. This tag can then be used to search and sort your streams and queries in the Analytics dashboards. This way you can get valuable business insight in any tagged event or stream you want to know more about!
Tags can be created by the bintu api or dashboard.
Here is an example of a bintu dashboard showing a list of streams with tags:
Selecting a time range and understanding your traffic usage
This widget provides the options to show your actual ingest/playback traffic usage given any time preference ( f.e. day/week/month/last 15 min ). All following widgets will show the information for the time preference chosen.
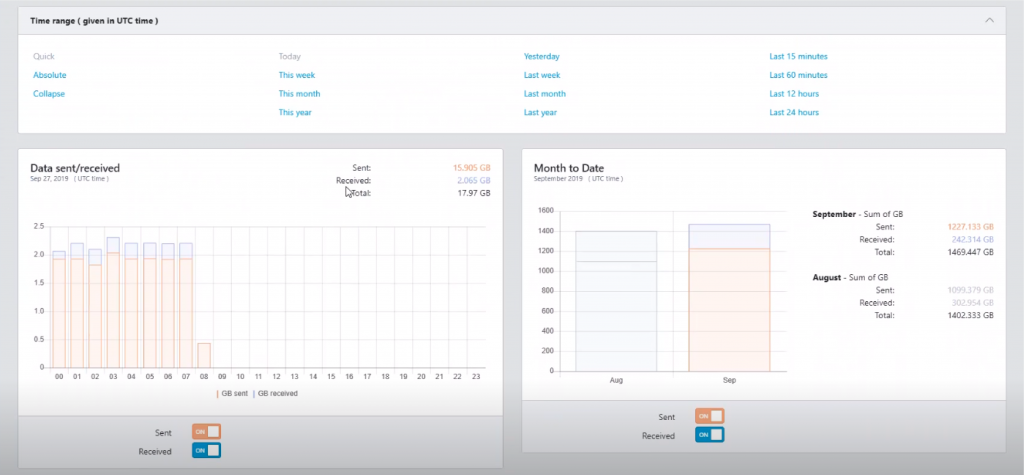
Getting insights: playout volume and countries
“Usage Playout” shows the volume of traffic you have used per date and stream type. Next to it is a widget that shows the percentage per country.

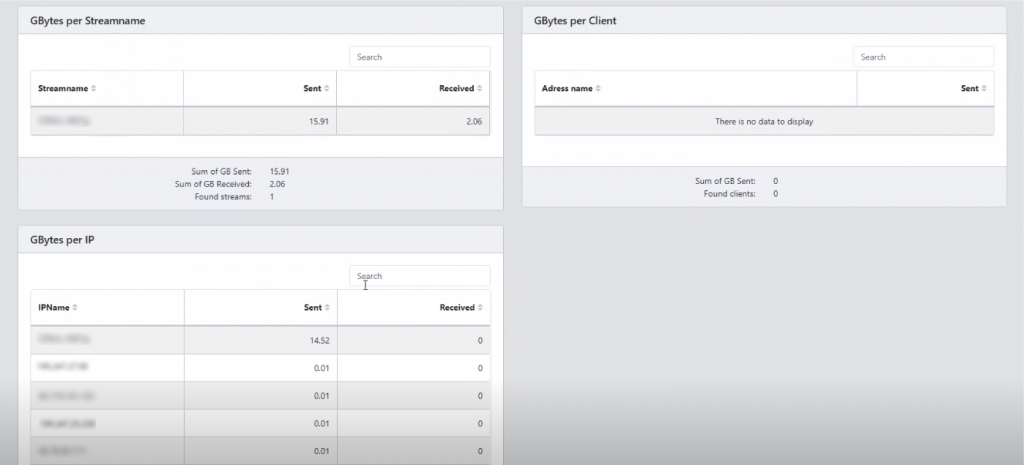
Learning your top notch customers: ingest/playback streams information
To know more about your ingest / playback streams the analytics dashboard shows the individual information per stream name, per client and the GB’s per IP. This information should provide you in detail who is using your service and who are your top notch users/customers.
Understanding your global footprint
Just recently we have added the world map overview to nanoStream Analytics dashboard. it will show the Playout / Ingest locations and percentages for your organization.
For nanoStream H5Live Metrics enabled accounts you will also be able to see:
- Buffering play ratio
- Latency
And other metrics we will add over time.
These values will be shown in three colors. A. Green – Yellow and Red that represent the status of the Quality of Experience for your viewers.
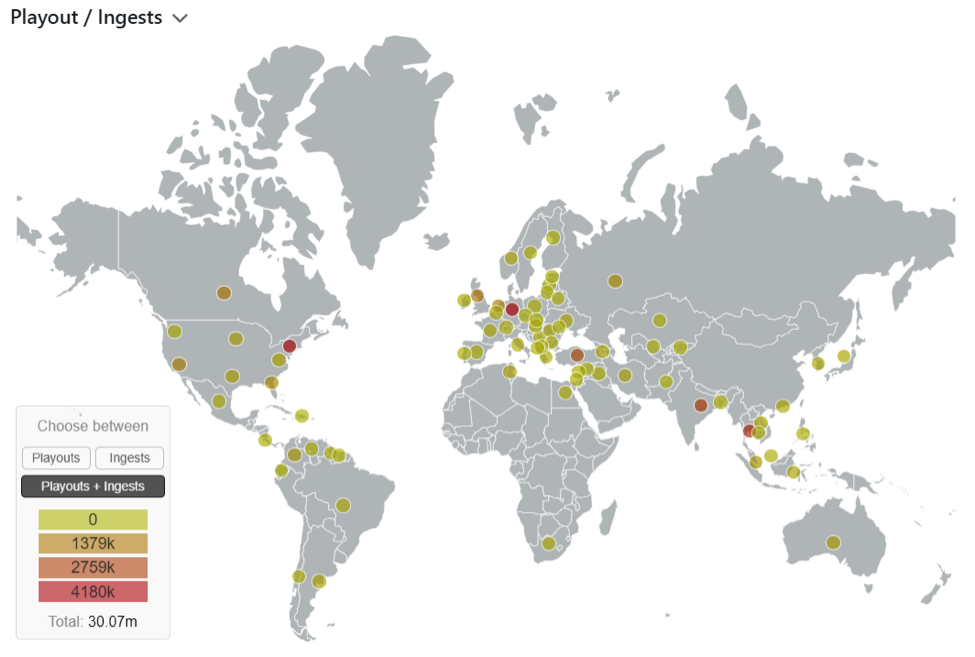
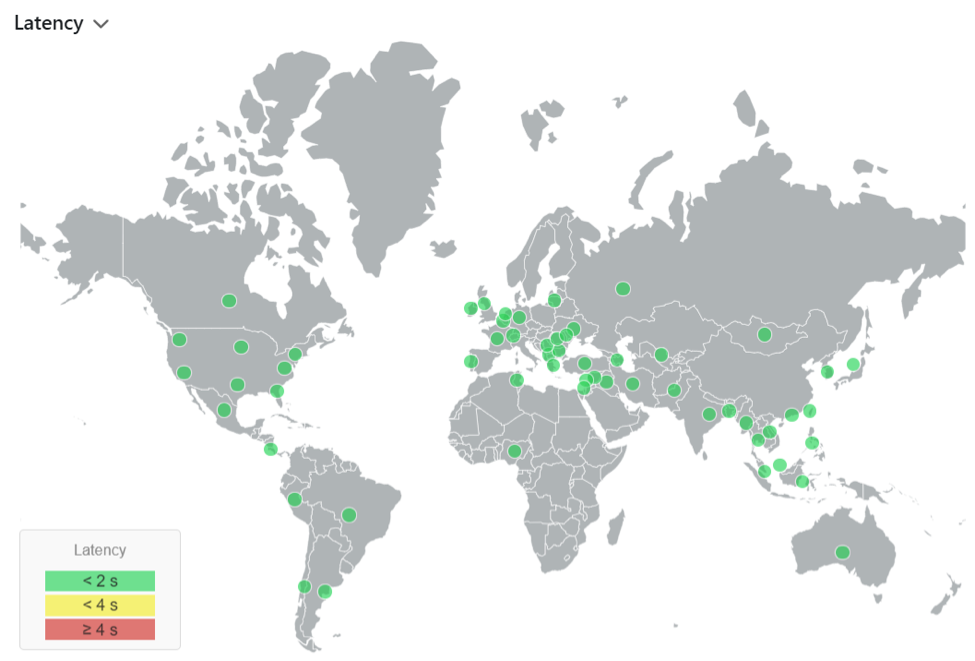
nanoStream H5Live Player Metrics: further information about your viewers Quality of Experience
Further Analytics widgets that will be available for nanoStream Cloud soon. Note that the information which is shown is based on the time preference you have chosen ( f.e. day/week/month/last 15 min. Etc. )
Details about which Operating Systems and Browsers the nanoStream H5Live Player is running on.

Details about max. concurrent H5Live viewers and reasons why the H5Live Player stopped. You can include/exclude certain errors and have only the ones you’re interested in.

Insight in Play buffering ratio and Player Loading count. Also here you can filter deeper per country.

Details about average and median player buffer length in seconds and median player startup time.

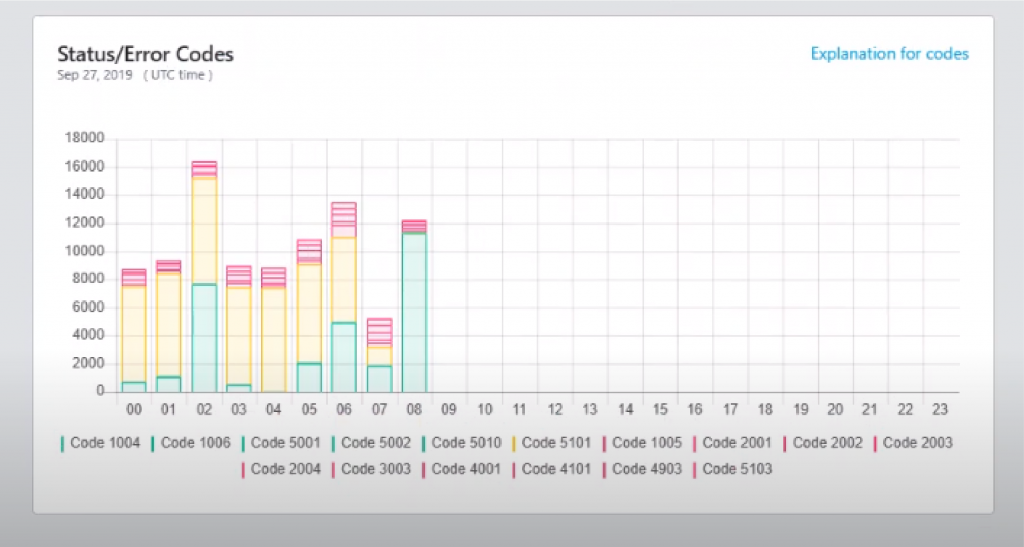
Another insight is the H5Live status error codes. You can get further explanations on these codes and you can include/exclude certain error codes to show.
nanoStream Analytics is part of nanoStream Cloud, our ultra-low latency interactive live streaming platform.
Start your nanoStream Cloud free trial and discover how the included nanoStream Analytics can help you improve your Quality of Service and your viewers Quality of Experience.
EXPLORE OUR DOCUMENTATION ABOUT NANOSTREAM CLOUD ANALYTICS.
WATCH OUR ANALYTICS TUTORIAL HERE.
NANOSTREAM CLOUD 2023 – LATEST ANALYTICS FEATURES.
READ MORE ABOUT WHAT VIDEO LATENCY IS POSSIBLE IN 2024 IN THIS ARTICLE.

